What to do when your puzzle solving is not as express as Santa's sleigh
Posted December 30, 2018
This week, FiveThirtyEight's Riddler Express is a puzzle about arranging Santa's reindeer. It came from Taylor Firman. Here's the puzzle:
Santa Claus is getting up there in age, and his memory has begun to falter. (After all, why do you think he keeps a list?) It’s gotten so bad that this year Santa forgot what order to put the reindeer in. Obviously, he remembers that Rudolph goes first because of the red organic light bulb in the middle of his face, but big guy just can’t remember what to do with the other eight.
If he doesn’t get the right order, the aerodynamics of his sleigh will be all wrong and he won’t be able to get all of his deliveries done in time. Yes, Santa has Moneyballed Christmas Eve. Luckily, the reindeer know where they should each be, but since they’re just animals they can only grunt in approval if they are put in the right spot.
Determined to get it right, Santa first creates a list of the reindeer in some random order. He then goes to the first position and harnesses each reindeer one by one, starting at the top of his list. When a reindeer grunts, Santa leaves it in that correct position, moves onto the next position, and works down that same list once again.
If harnessing a reindeer into any spot takes one minute, how long on average would it take Santa to get the correct reindeer placement?
Extra credit: Is there a strategy that Santa could use that does better?
This puzzle was labeled as a "Riddler Express," but I actually spent quite a bit of time solving it, particularly the extra-credit problem. There are usually three days between when Riddler puzzle is released and when it is due, but since it was the holidays, we got an extra week, and I was glad to have it. In the end, my proof is not all that complicated, but to get there I had to be persistant and try a lot of different things. It reminded me a lot of doing math research - you can have a lot of ideas that don't work before finally hitting on a strategy that succeeds, but you wouldn't have gotten to that last successful idea without all the persistance and struggle and failure, and the intuition you build along the way.
Since I've have been thinking about productively struggling in math, and the process of solving a problem, I decided to write a little bit about how I solve a math problem in this post. Although the puzzle included two questions (the main puzzle and an extra credit puzzle), in my circuitous route to a solution, I came up with at least two other questions that I was interested in, so actually addressed at least four questions in total. Those questions are
- (Main puzzle) How long on average would it take to get the correct reindeer placement?
- (Extra credit) Is there a strategy that Santa can use that does better on average?
- How long would it take to get the correct reindeer placement in the worse case? (One way to think about this: what if some mischievious elf messed with Santa's random order of reindeer to make it as bad as possible?)
- Is there a strategy that Santa can use that does better in the worst case?
First, I tackled questions 1. This is a calculation problem of a kind that I have a lot of practice with. I was a little stumped on how to address question 2, but anyway I got a little distracted when I thought up questions 3 and 4. These questions were appealing to me partly because they are related to problems I solved before - I like math problems where one wants to bound what happens in the worst case. And anyway they seemed easier than question 2 and I was stuck on question 2, so maybe I could get these done first. I hoped that the understanding that I would build solving problems 3 and 4 would help me when I went back to try question 2. I think this ended up being the case. Question 3 was another calculation, while question 4 made me think a little harder. Then, solving question 2 took a bunch more time after that.
In the below, I start with my solutions to questions 1 and 3. Then, I show my solution to question 4. Next, I take an interlude to reflect more on my problem-solving process. Finally, we'll go through my solution to question 2.
1. How long on average would it take to get the correct reindeer placement?
Let's say there are \(n\) reindeer. Let's consider the situation when there are \(k\) reindeer left to place, after \(n - k\) have already been harnessed, and Santa goes to try to fill the next position. How many minutes will this take? It's equally likely that Santa will succeed on the first, second, third, ..., \(k\)th try. So, on average, it takes \(\frac{k + 1}{2}\) minutes to fill this position. To get the average number of minutes in total, we can add up the average number of minutes that it takes to fill each position (because expectation is linear). This is \(\frac{n + 1}{2} + \frac{n}{2} + \frac{n - 1}{2} + \dots + \frac{2}{2} = \frac{n^2 + 3n}{4}\) minutes. Since Santa has \(n = 8\) reindeer besides Rudolph, it takes him on average \(\frac{8^2 + 3 \cdot 8}{4} = 22\) minutes.
Alternate solution
Consider any \(1 \leq a, b \leq n\). What is the probability that Santa takes the reindeer that belongs in position \(a\) and tries it in position \(b\)? There are three cases:
Case 1: If \(a < b\), then Santa does not this reindeer in position \(b\).
Case 2: If \(a = b\), then Santa does eventually correctly put this reindeer in position \(b\). There are \(n\) such values of \(a, b\), so this accounts for \(n\) minutes.
Case 3: If \(a > b\), then Santa tries this reindeer in position \(b\) if and only if this reindeer is earlier in the list than the reindeer that actually belongs there. This happens with probability \(1 / 2\). There are \(\frac{n(n - 1)}{2}\) such values of \(a, b\), so this accounts for \(\frac{n(n - 1)}{4}\) minutes on average.
Summing up the above, the average number of minutes for the entire process is \(\frac{n (n + 3)}{4}\). Since Santa has \(n = 8\) reindeer other than Rudolph, it takes him \(\frac{8^2 + 3 \cdot 8}{4} = 22\) minutes on average.
3. How long would it take to get the correct reindeer placement in the worse case?
When there are \(k\) reindeer left to place, in the worst case, Santa needs to try all \(k\) of them in the next position. With \(n\) reindeer total, the total number of minutes to place all \(n\) reindeer in the worst case is \(n + (n - 1) + (n - 2) + \dots + 2 + 1 = \frac{n (n + 1)}{2}\).
4. Is there a strategy that Santa can use that does better in the worst case?
We've gotten through the two questions that are just calculations. For the other two questions, we'll need a proof. The solution to this question is not directly needed for the final proof, of the extra credit question, question 2. But I included it for two reasons. For one, I think it's kinda interesting. And for another, I think that solving this problem helped me get a better grasp on the situation, and the intuition I gained ultimately helped me indirectly with solving question 2.
I claim that there is no strategy that does better than Santa's current strategy in the worst case.
I have a proof that there's no better strategy, but how did I know in the first place that there was no better strategy and so this was the right thing to prove? I didn't. I simultaneously tried finding a strategy that did better, and tried finding a proof that you can't do better, alternating between these two goals until something worked. I first came up with a few different strategies for Santa to try. What if, instead of trying each reindeer in a given position until something worked, Santa picked a reindeer and tried it in different positions until something worked? That turns out to take the same amount of time as Santa's original plan in the worst case (actually, this is also true in the average case). What if Santa tried one reindeer in the first position, then a different one in the second position, and a different one in the third position, and so on? This description is ambiguous, but generally strategies that are like this seem to take more time, not less. Santa's original plan started to seem pretty efficient, so at this point I began suspecting that it was optimal.
At this point, I also wanted a mathematical structure to keep track of the state of affairs as Santa's strategy plays out. It's fun to think about reindeer frolicing around in the snow and trying on harnesses at the North Pole, but it distracts me a bit and makes it harder to keep track of the mathematically relevant information. I wanted a representation that contains all the relevant information and not too much extraneous information. I needed it to be something that I can manipulate in my mind and reason about.
For now, we'll use a bipartite graph. The \(n\) reindeer are represented by a column of \(n\) vertices on the left. The \(n\) positions are represented by a column of \(n\) vertices on the right. We'll connect each reindeer vertex to a position vertex by a thin edge to indicate that that it is viable that the reindeer matches up to that position. By viable, I mean that Santa hasn't already unsuccessfully tried to put that reindeer in that position, and also that neither the reindeer nor the position has been otherwise committed. Two vertices that are connected by an edge are said to be neighbors or adjacent.
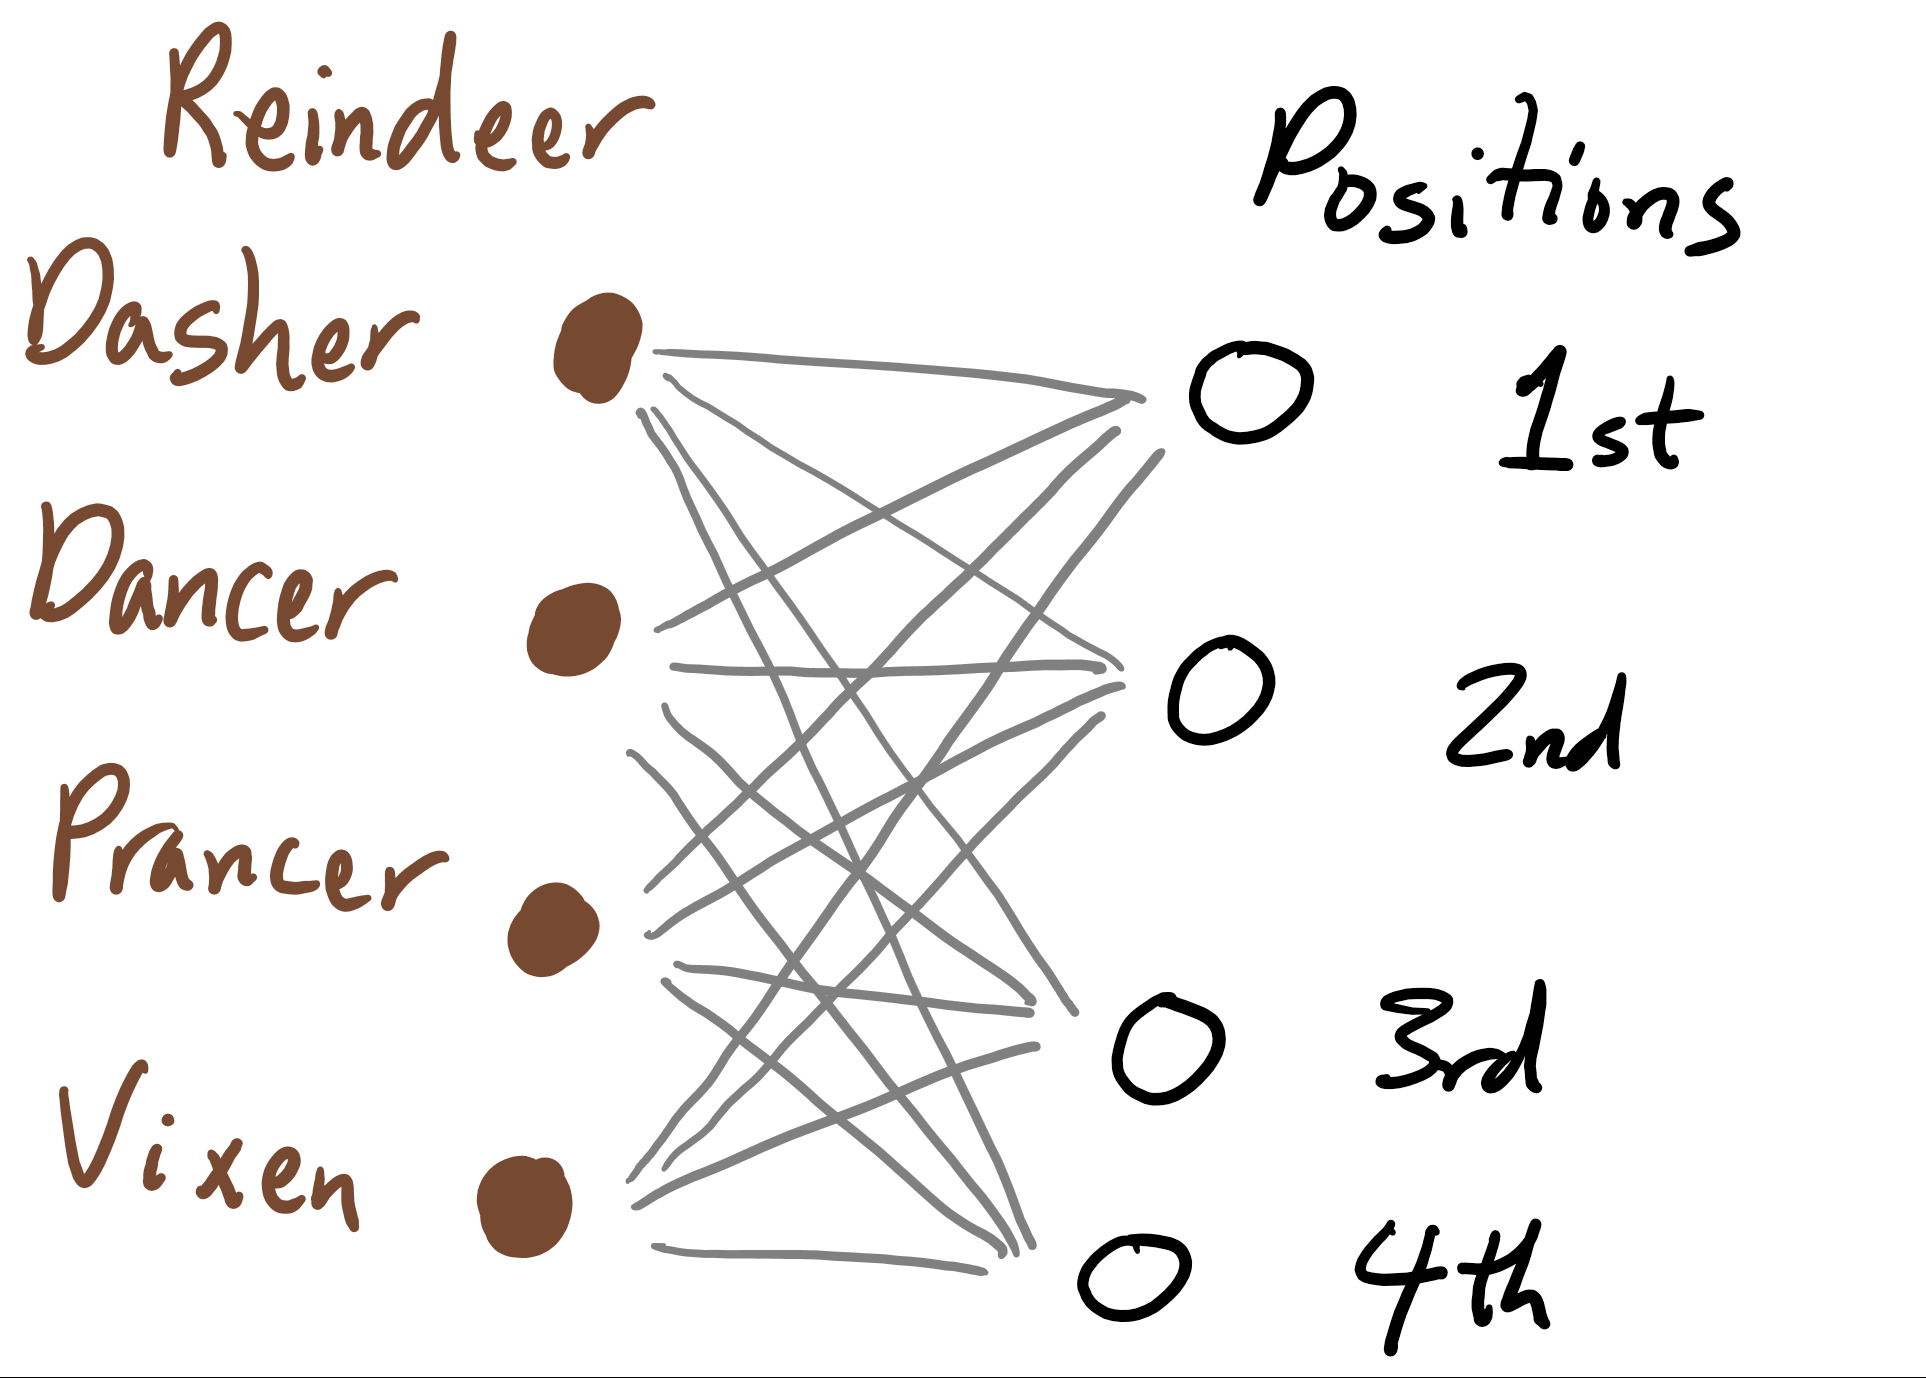
In a bipartite graph with \(n\) vertices on the left and \(n\) vertices on the right, a set of \(n\) edges no two of which share a vertex is called a perfect matching. A perfect matching pairs off each left vertext with a right vertex and vice-versa; each vertex is involved in exactly one edge of the matching. We know that throughout our process, our bipartite graph always has at least one perfect matching in it: it has the matching that corresponds to the correct assignment of each reindeer to a position. There may be other perfect matchings in our graph too - actually the fact that there may be other perfect matchings is the whole source of our conundrum, because Santa doesn't know which matching represents the correct assignment.
As Santa goes through the process, we can update our graph to reflect Santa's current state of knowledge. To start out, every reindeer vertex is adjacent via an edge to every position vertex.

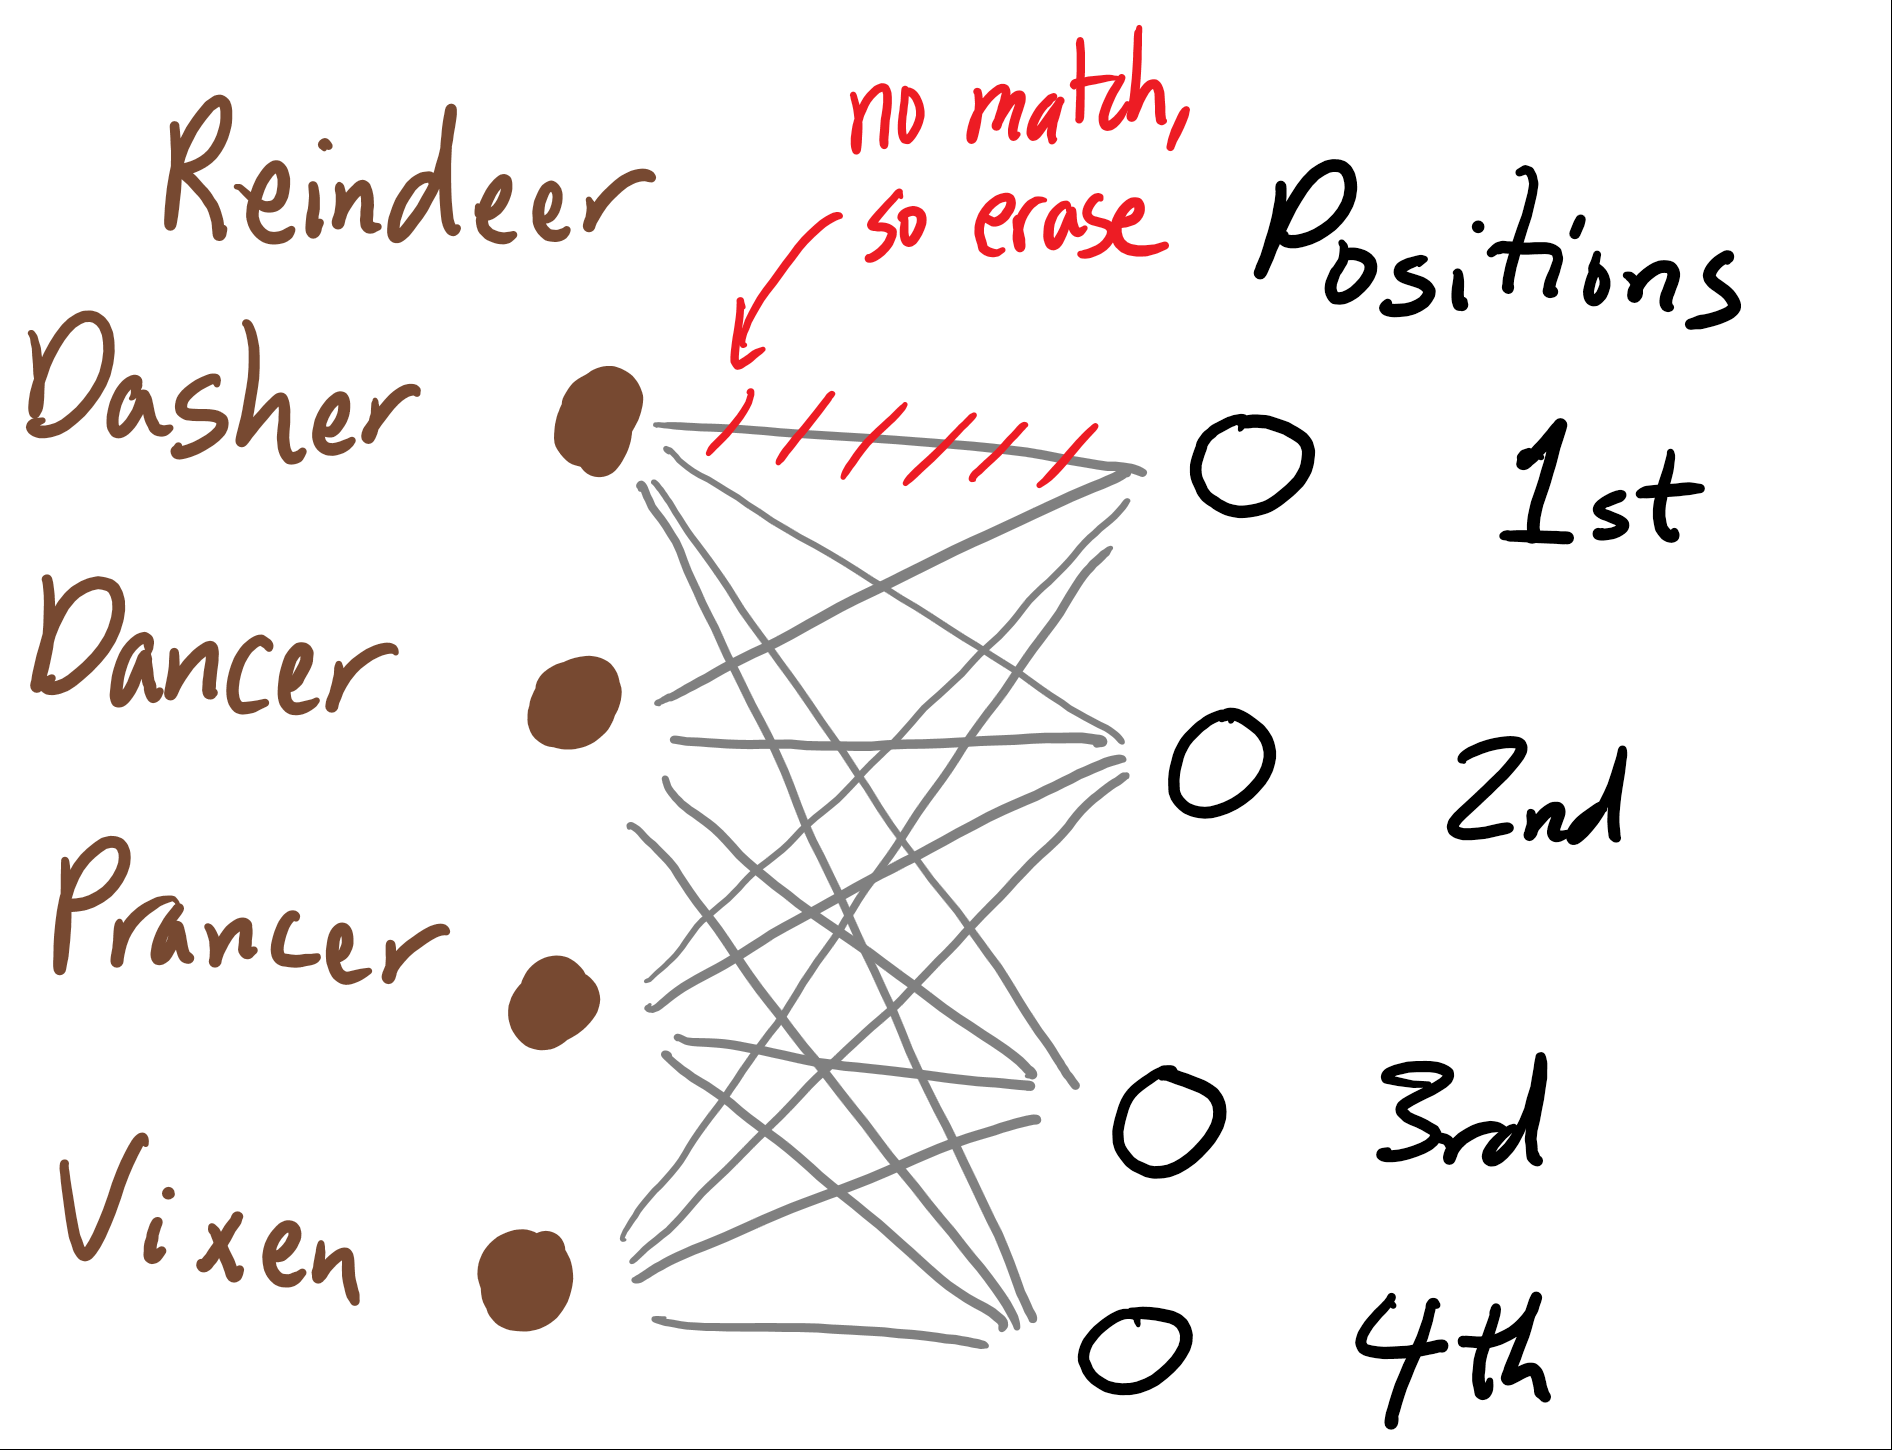
If Santa tries putting a reindeer in a certain position and it doesn't grunt, Santa learns that that reindeer doesn't belong there, and we can erase the corresponding edge from our graph. We'll say that these edges are explicitly deleted.
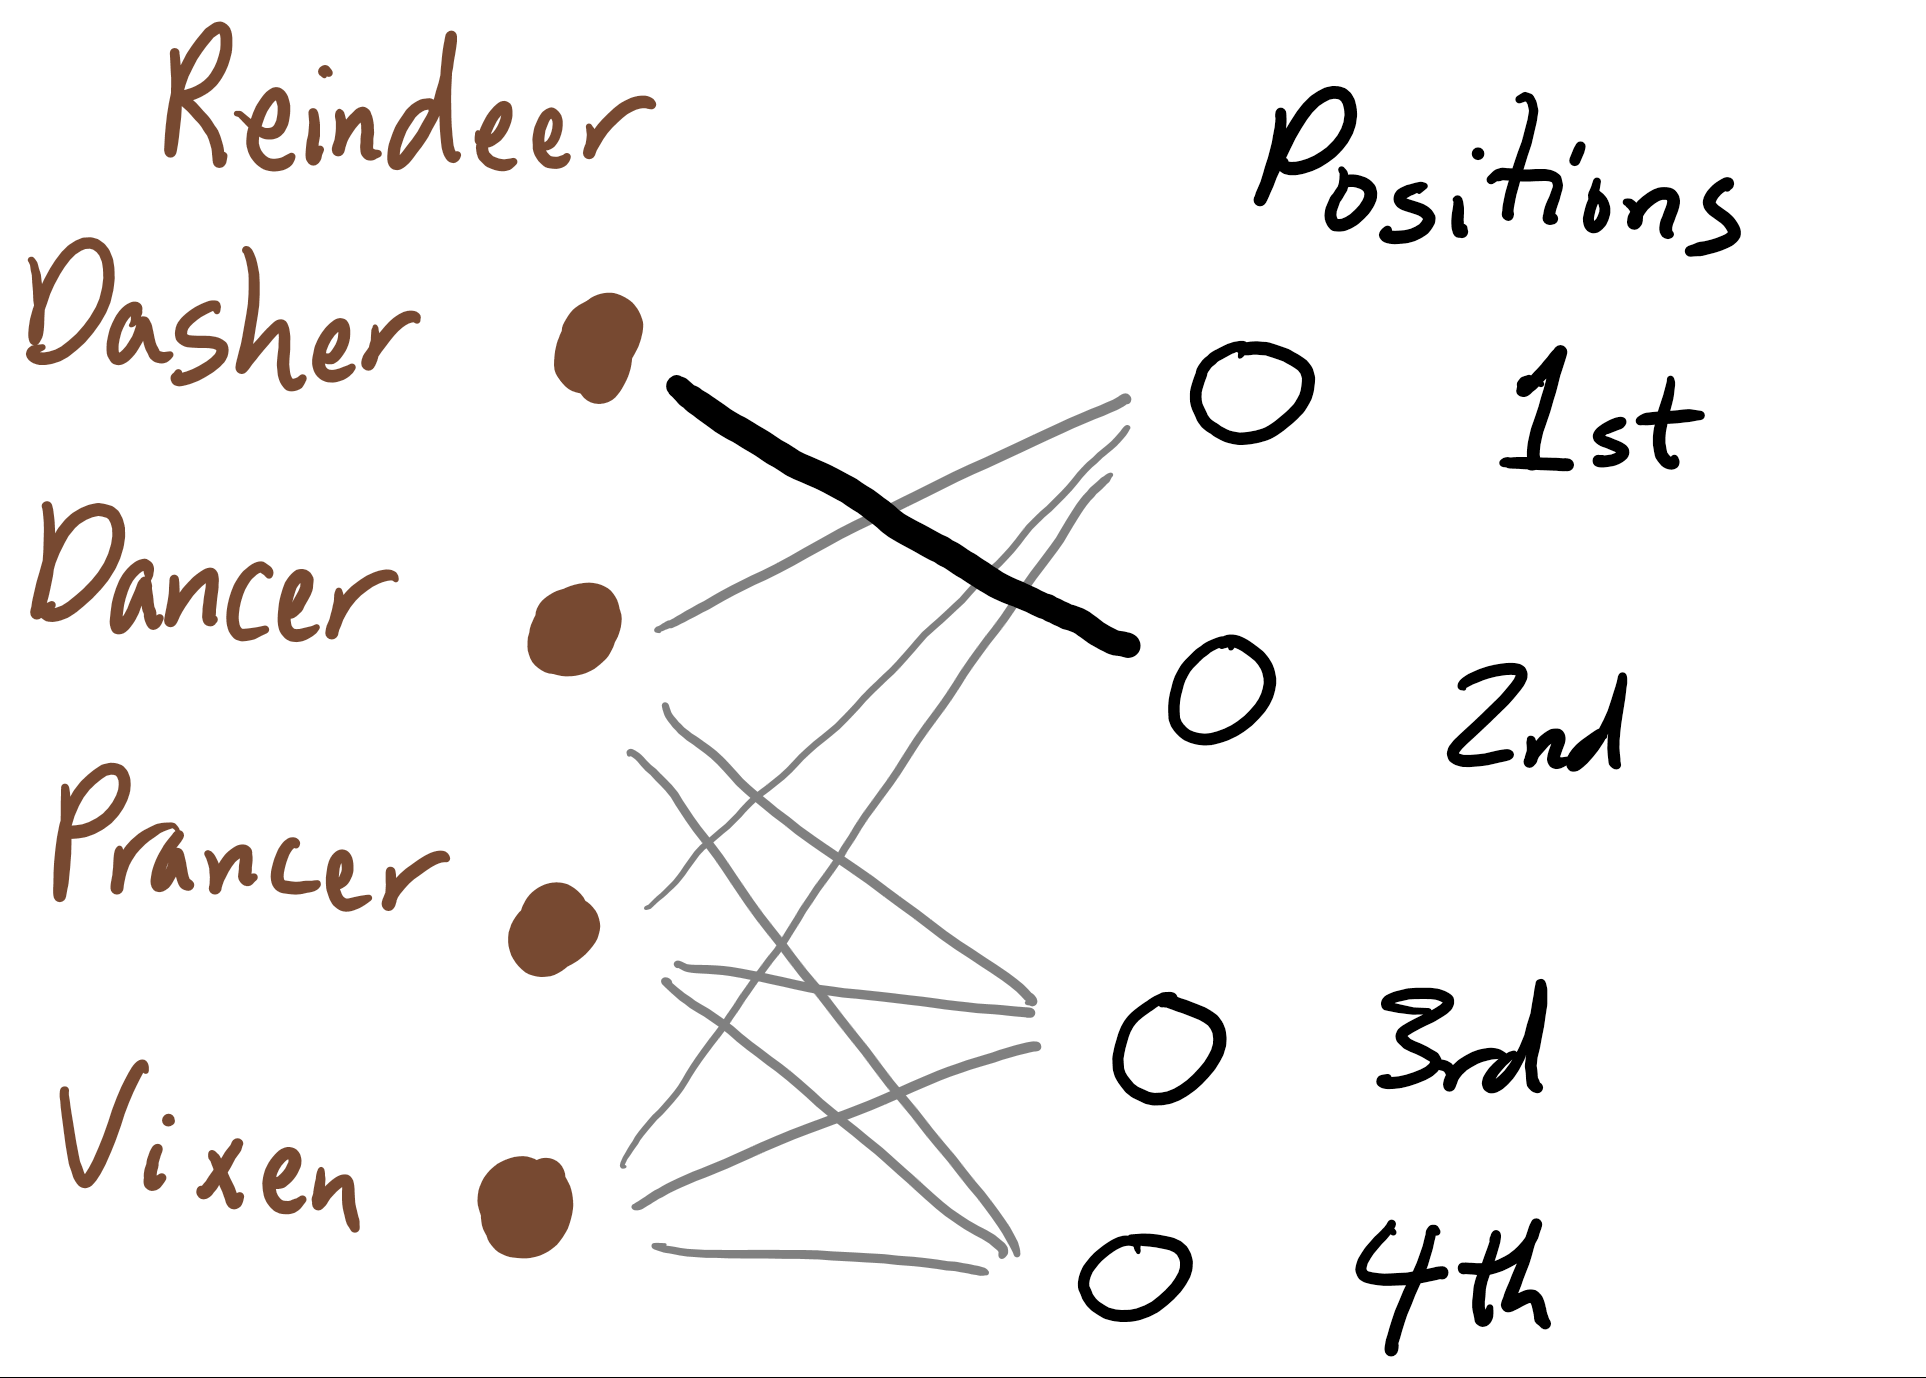
If Santa pus a reindeer in a position and it does grunt, he knows that the reindeer is in the right place. We'll mark this on our bipartite graph by making the corresponding edge thick. All the other edges that go out of these two vertices are no longer viable, so we'll delete them. We'll say that these edges are incidentally deleted.
There are couple more things that are nice about representing the situation with bipartite graphs. We can see that there is symmetry. Santa's original plan is to try all the reindeer in a particular position until one works before moving onto the next position. Another strategy we thought of was to try a single reindeer in every posistion until one works, and then moving onto the next reindeer. These two strategies are essentially the same strategy, however; thinking in terms of the bipartite graphs, one is basically the left-right mirror image of the other. So we know that neither is better than the other.
Another advantage of using bipartite graphs is that they are an object that I've thought about before - and that other mathematicians have thought about before. So I have some intuition about how they work, and know some theorems that might be useful here. In fact, the phrase "perfect matching" is standard terminology, and perfect matchings have been studied before.
We're interested in the number of minutes Santa takes. This is equal to the number of edges that get thickened (\(n\)), plus the number of edges that are explicity deleted. It is then also equal to the number of edges to start (\(n^2\)), minus the number of edges that are incidentally deleted. So, we can think about what strategy for Santa guarantees that as many edges are incidentally deleted as possible. One worries that if Santa's unlucky, every single edge that gets deleted is deleted explicitly. But, Santa can avoid this, because there is always a perfect matching in the graph - an edge will not be deleted if deleting that edge would mean that there would no longer be a perfect matching in the graph.
We care about deleting edges from a bipartite graph, and about when there is a matching in a bipartite graph. In particular, if you delete an edge from a graph with a perfect matching, will there still be a perfect matching? And how does the answer to this question depend on the number of edges that stand to be deleted incidentally if this edge gets thickened? After some thought and some experimentation, I honed in on this lemma.
Lemma 1. Let \(G\) be a bipartite graph with \(n\) left vertices and \(n\) right vertices, and which has a perfect matching. Let \(\{x, y\}\) be an edge of \(G\), and let \(G'\) be the result of removing this edge from \(G\). Let \(a\) be the number of edges in \(G'\) that have either \(x\) or \(y\) as an endpoint. If \(a \geq n\), then \(G'\) also has a perfect matching.
Note that \(a\) is the number of edges that would be indidentally deleted if the edge from \(x\) to \(y\) were thickened.
Proof. We know that \(G\) has a matching \(M\). If \(M\) does not include the edge from \(x\) to \(y\), then this matching is also in \(G'\), and we are done. So, suppose \(M\) does contain this edge. Let \(A\) be the set of vertices that are adjacent to \(x\) or \(y\) in \(G'\).
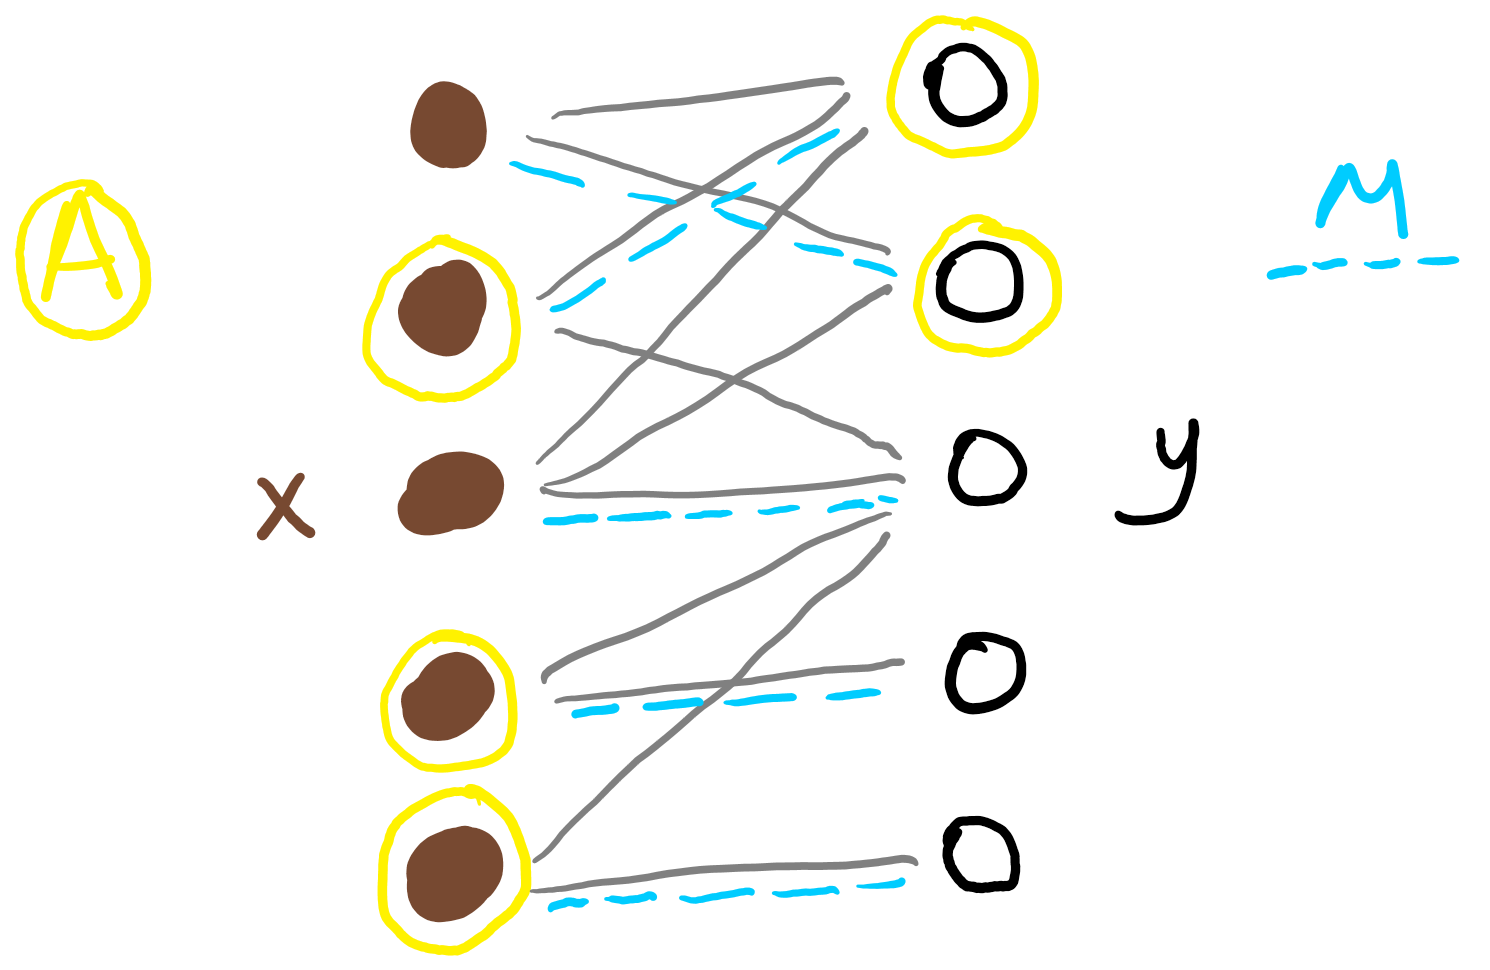
We know that \(\newcommand{\abs}[1]{\lvert #1 \rvert} \abs{A} = a \geq n\). We know that each of these vertices is included in one of the \(n - 1\) edges of \(M\) other than the edge from \(x\) to \(y\). So (by the Pigeonhole Principle), there is some edge of \(M\) where both of its vertices are in \(A\). This edge has a vertex \(u\) that is adjacent to \(y\), and a vertex \(v\) that is adjacent to \(x\).
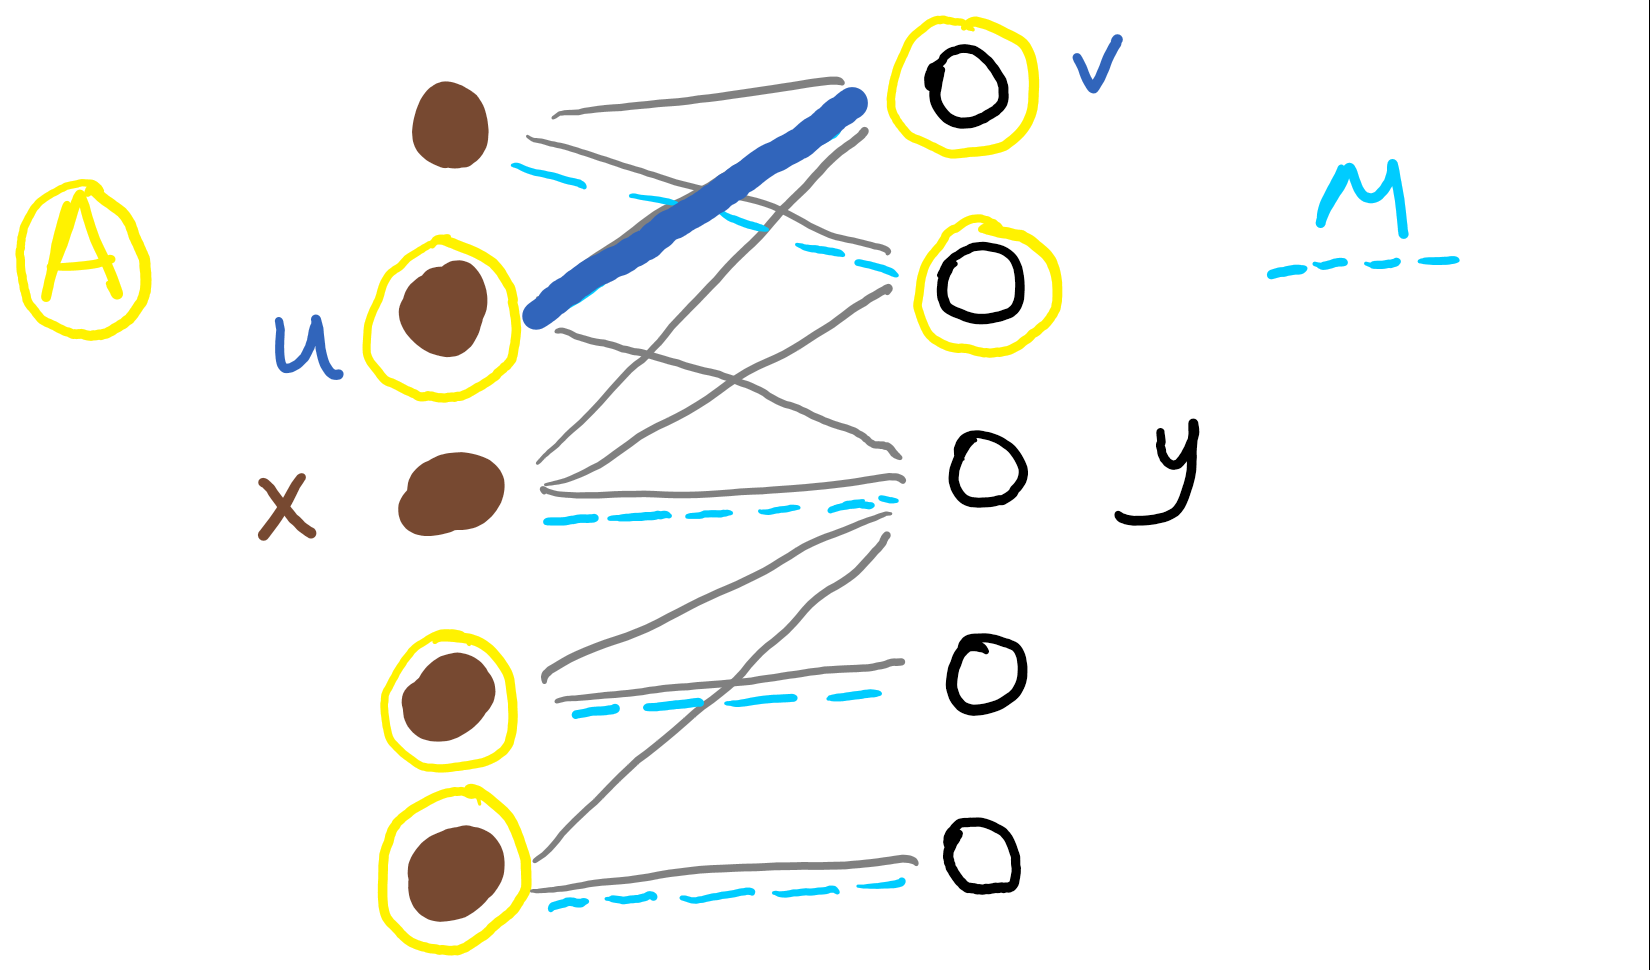
Take the matching \(M\), remove the edge from \(x\) to \(y\) and the edge from \(u\) to \(v\), and add in the edge from \(u\) to \(y\) and the edge from \(v\) to \(x\); call the result \(M'\).

Then, \(M'\) is a matching in \(G'\). \(\square\)
Santa wants to put all reindeer in their correct position as quickly as possible, even for the worst possible perfect matching of reindeer to positions. Since we care about this worst case, suppose there is a mischevious elf who gets to choose that matching, and is trying to make the the process take as long as possible. Specifically, whenever Santa tries harnessing a reindeer in a position, the elf gets to decide whether the reindeer belongs there (and thus whether it grunts). She is free to make any choice she'd like, as long as her choices are consistent with some perfect matching of reindeer to positions. She does not even need to choose a single perfect matching ahead of time), as long as at every point in time there is at least one perfect matching still possible. We will investigate how long the elf can force the process to take.
We will have the elf use a greedy strategy. When Santa tries harnessing a reindeer to see if it fits, the elf will decide that no it doesn't fit, as long as this choice is consistent with at least one perfect matching. If saying no is not consistent with a perfect matching, then she says that yes, this reindeer does fit. This must be consistent with a perfect matching, because there is at least one perfect matching.
Let's analyze how much time this forces Santa to take. Thinking back to our model of the problem as a bipartite graph, recall that the number of minutes is equal to \(n^2\) minus the number of edges that are incidentally deleted. Some edges are incidentally deleted every time the elf answers yes. Starting with \(n\) reindeer and \(n\) positions, Lemma 1 tells us that the first time she says yes, at most \(n - 1\) incidental edges are deleted (if she says yes, it means that removing that edge would result in a graph with no perfect matchings). More generally, when there are \(k\) reindeer and \(k\) positions left to match, the next time the elf says yes, at most \(k - 1\) edges are incidentally deleted by Lemma 1. So in total at most \((n - 1) + (n - 2) + \dots + 2 + 1 = \frac{n (n - 1)}{2}\) edges are removed incidentally. So, the number of minutes spent is at least \(n^2 - \frac{n (n - 1)}{2} = \frac{n (n + 1)}{2}\).
As we calculated earlier, this is exactly how much time Santa needs in the worst case using his original strategy, so that strategy is optimal.
Some reflections on problem solving
Let's take stock of where we are now. After addressing question 1, which was the main puzzle, I came up with question 3 and 4. There were a couple reasons I went this direction. For one, these questions came to me as natural questions that I was curious about. They seemed related to questions I had thought about before (including my actual research on decision tree complexity and evasiveness), which both gave me motivation for thinking about them, as well as thoughts of how to solve them. Another reason I thought about these questions was that I wanted to solve question 2 (the extra-credit question), but didn't know how, so this gave me something to do in the mean time, and also, I hoped, would help me build my intuition on the problem.
After tackling these additional questions, whose solutions are above, it was time to go back and attempt question 2. I had a lot of different ideas of solutions strategies. The one that ended up being successful was one that I sort of thought of early on, but didn't know how to flesh out, so I set aside while I tried other ideas. To think about these solution strategies, I also came up with other mathematical models of the situation. One model is the bipartite graph model which we used earlier. I also found it useful to think about this information as a grid. Each row of the grid represents one reindeer, and each column represents one position. An "X" in a grid square means that the reindeer in that row does not belong in the position in the column. An "O" means that it does belong. A blank square means that we don't know.

The grid model holds all the same information as the bipartite graph model. But, I often found the grid model easier to work with when trying ideas, because it was easier to picture in my head then a graph with criss-crossing edges. But really, I tried a bunch of different things from a bunch of different perspectives, so it was useful to have different models that I could think about each of which highlighed different aspects of the situation.
In the grid model, if the grid has no "O" (so that ever grid square has an "X" or is blank), we can convert it into a matrix where each "X" becomes a 0 and each blank becomes a 1. Comparing to the bipartite graph model, this matrix is called the incidence matrix of the bipartite graph.
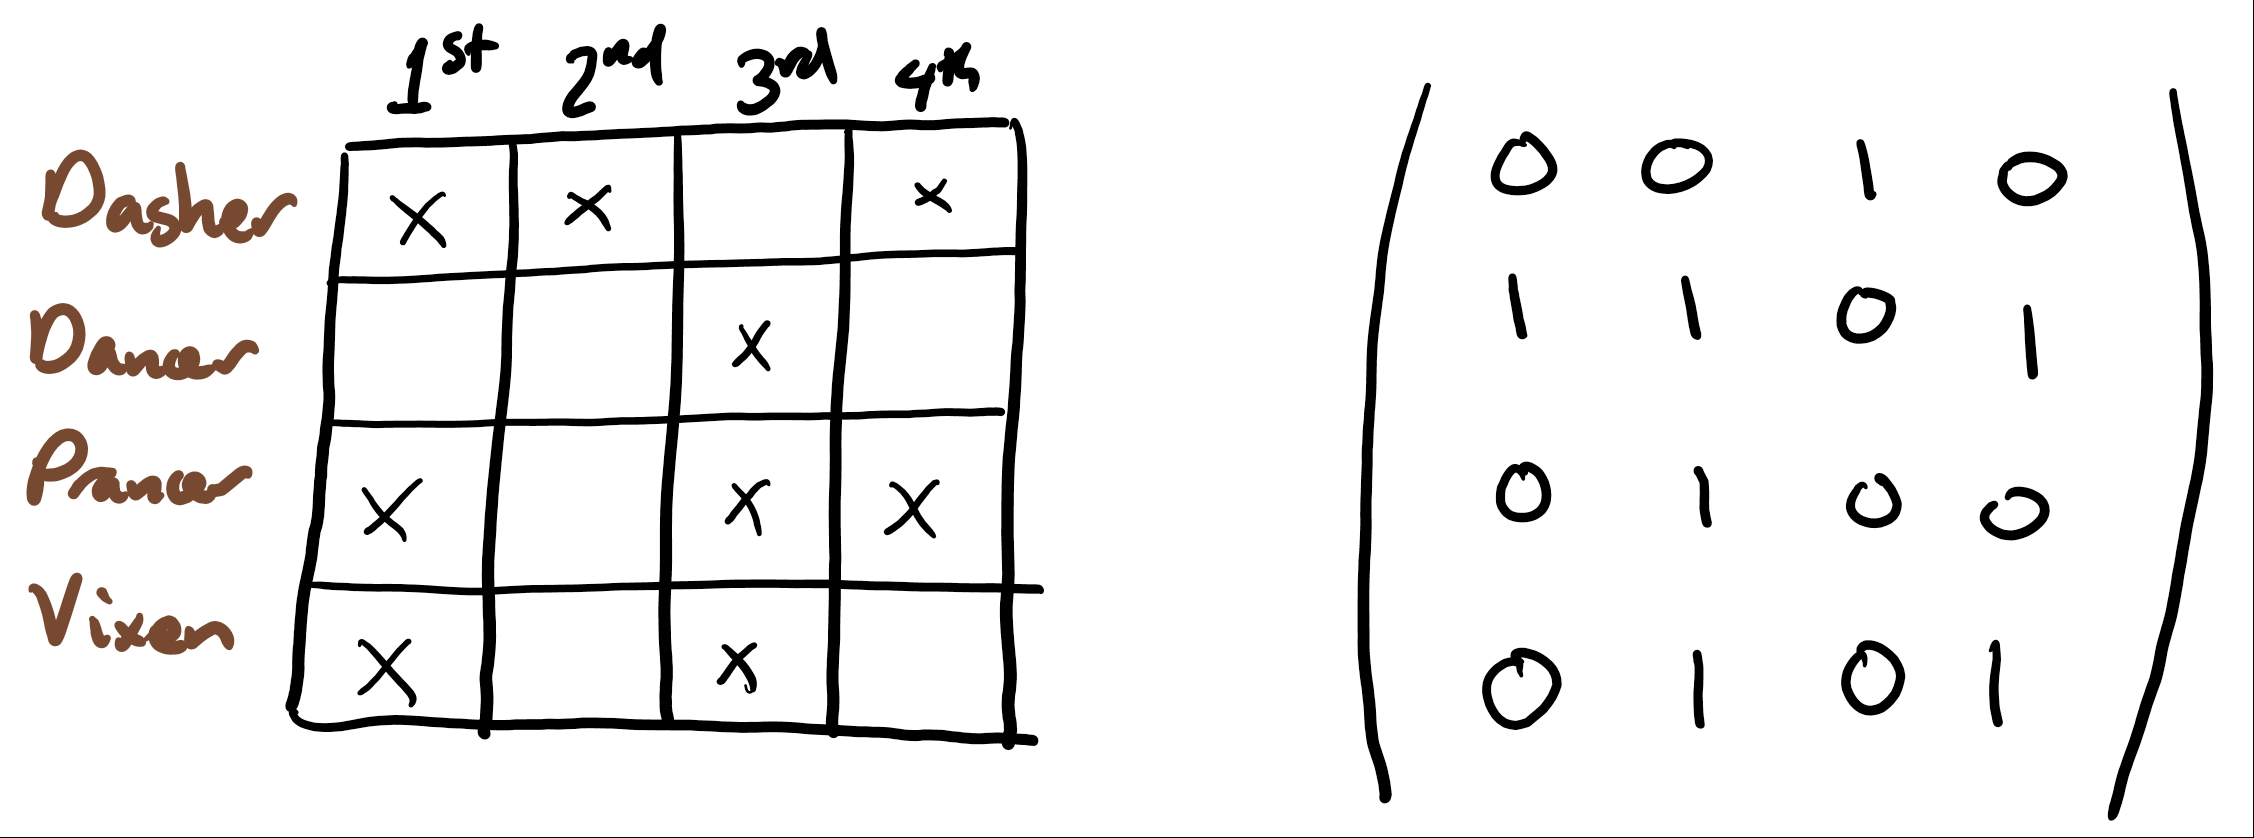
This is similar to the grid model. I didn't think as much about this, because it's harder to hold as a picture in my mind, but it has the advantage that there are lots of things known about matrices. For example, if you take the permanent of the incidence matrix, you get the number of perfect matchings in the bipartite graph. This was we get to tap into anything that is already known about the permanent (which is a relative of the determinant). I tried some things in this direction, and while it may have swayed my intuition, the permanent didn't play a role in my final solution.
I've mentioned a couple times connections to established facts from math that I know of. In research math, it's important to know what other people have already done and what sorts of problems are currently being worked on. It's important so that you don't spend too much time re-solving something that has already been solved. It's also important because math is a community. The problems that are deemed important and the big directions in which to move are built as a community, and to be part of that, it's important to know what others are doing. I treat the Riddler a little differently. I enjoy discussing the puzzles with friends and strangers, but I avoid looking up what is already known, becuase that feels like a spoiler. I do however draw on my past experience and outside results that I already know.
In the next section, I present my solution. But I wanted to talk about my process first, because there was a lot that happened in my process that allowed me to solve the problem, but is not visible in the final solution. For example, the grid model featured heavily in my problem-solving process, even though I ended up writing my solution just refering to the bipartite graph model.
2. Is there a strategy that Santa can use that does better on average?
I claim that there is no strategy that does better than Santa's original strategy. With \(n\) reindeer, that strategy took \(\frac{n (n + 3)}{2}\) minutes on average.
Theorem 2. If Santa has \(n\) reindeer, then no matter which strategy he uses, he will need at least \(\frac{n (n + 3)}{2}\) minutes on average to harness all the reindeer.
Here's the basic structure of the proof. As a bookkeeping mechanism, we will say that every time that Santa attempts to harness a reindeer, he receives some amount of treasure. We will carefully select the amounts of treasure such that he receives an average of at most one dollar of treasure for each attempt. That way, the average number of total attempts (which equals the average number of minutes) is at least the average value of the treasure he ends up with. Then, we will show that he ends up with at least \(\frac{n (n + 3)}{2}\) dollars of treasure on average (no matter the strategy), and this will let us conclude that on average he uses at least that same number of minutes.
The tricky part of making this proof idea work is figuring out how much treasure to assign to Santa on each attempt. The concept of treasure is something that I am introducing to the problem, so I am in a sense totally free to decide how much treasure to give Santa in any situation. On the other hand, there sort of is a "right" way of assigning treasure, because if I do it wrong, the rest of my proof idea won't work. So, this took some thought and care. Let's go through the clues that we have to guide us in this decision.
We know that each time Santa tries harnessing a reindeer, the average value of treasure he receives, averaged over all the possible assignments of reindeer to positions, should be at most one dollar. Probably he should receive more for a successful attempt than an unsuccessful one, since a success usually represents a bigger step toward is ultimate goal. There's one other clue to how we should assign these values. When Santa follows his original strategy, we can replace "at most one dollar" with "exactly one dollar," since we believe that this strategy is optimal and should have no "inefficiency." This clue was particularly helpful when I was trying to figure out how to assign values. I looked at how much a successful attempt (or an unsuccessful attempt) decreased the expected number of minutes remaining in the process when Santa followed his original strategy. The amount of that decrease needed to be exactly equal to the value of treasure Santa earned in that situation. This helped a lot in assigning values, but didn't tell me everything: I need to decide how to pay Santa even when he's following other strategies that involve other situations. This is part of why I didn't get this proof idea to work right away, and went on to try other things for a while before coming back to this idea. But this idea did eventually work, with the values that I am about to describe.
Every time Santa tries putting a reindeer in a position in which it does not fit, he gets a silver coin. The face of that silver coin pictures that reindeer and that position number. When Santa puts a reindeer in a position that it belongs, he gets a gold coin. But, he must give back any silver coins that feature that reindeer or that position position number.
Each silver coin is worth half a dollar. The value of a gold coin depends on which coin it is. The last gold coin earned (when the last reindeer is succesfully harnessed) is worth 1 dollar. The \(k\)th-to-last gold coin earned is worth \(\frac{k + 1}{2}\) dollars.
As mentioned above, we will show that the average number of minutes is at least the average value of treasure earned, for any strategy. So, we would like to have a lower bound on the average value of treasure earned. Actually, we can do even better than that - the total value of treasure earned is always exactly a set amount.
Lemma 3. When all reindeer are properly harnessed, Santa has exactly \(\frac{n (n + 3)}{2}\) dollars of treasure.
Proof. Santa has \(n\) gold coins, one for each reindeer. He gave back all his silver coins, so has none left. The total value of his gold coins is \(\frac{n + 1}{2} + \frac{n}{2} + \frac{n - 1}{2} + \dots + \frac{3}{2} + \frac{2}{2} = \frac{n (n + 3)}{2}\). \(\square\)
Our last loose end is calculating how much treasure Santa earns on average each time he attempts to harness a reindeer.
Lemma 4. Every time Santa harnesses a reindeer, he earns at most one dollar of treasure on average. The average is taken over all valid assigments of reindeer to positions.
We'll build up to Lemma 4 through a sequence of technical lemmas. This is where we get down and dirty with bipartite graphs. The phrase "technical lemma" is sometimes a warning sign that the proof that you are about to read will seem to come out of nowhere. So let me try to say a few words about where this is coming from. As often is the case in math, the order in which this is written up is different from the order in which I solved it. I knew that I wanted to prove Lemma 4. I worked backward from that to come up with the statement of Lemma 6, below. This was a lemma phrased just in terms of bipartite graphs, which meant there were fewer moving parts to worry about. Actually, I was at the time thinking in terms of the grid model that I described in the previous section. The next step from there is the hardest to describe. I already had some partial progress in that direction from the work I had already done. I tried a lot of small cases - for example, what if there are three reindeer and three positions and there has been one unsuccessful harnessing; what can I say about this case? And I did some sorts of thinking that are hard to describe. Eventually I had a proof. Before writing down the proof I took a little more time to smooth it out into something that would be a little easier to read. This is when I switched from the grid model back to the bipartite graph model, and added in Lemma 5 (below) as an intermediate step. What follows is the result of this.
Lemma 5. Let \(G\) be a bipartite graph with \(n\) left vertices and \(n\) right vertices. Let \(x\) be a left vertex and \(y\) a right vertex. Suppose that \(x\) is adjacent to every right vertex, and \(y\) is adjacent to every left vertex. Let \(m\) be the number of perfect matchings in \(G\). Let \(m_{x, y}\) be the number of perfect matchings in \(G\) that include the edge from \(x\) to \(y\). Then, \[ n \cdot m_{x, y} \leq m. \]
Proof. For any right vertex \(v\) of \(G\), let \(\mathfrak{M}_{x, v}\) be the set of all perfect matchings in \(G\) that include the edge from \(x\) to \(v\), and let \(m_{x, v}\) be the number of such perfect matchings. We will show that \(m_{x, y} \leq m_{x, v}\) for any right vertex \(v\). Then, summing over all right vertices \(v\), we will have that \[ n \cdot m_{x, y} = \sum_{w} m_{x, y} \leq \sum_{w} m_{x, v} = m. \]
Let \(v\) be any right vertex of \(G\) other than \(y\). To show that \(m_{x, y} \leq m_{x, v}\), we will associate each perfect matching from \(\mathfrak{M}_{x, y}\) with a distinct perfect matching from \(\mathfrak{M}_{x, v}\). Specifically, consider any perfect matching \(M\) from \(\mathfrak{M}_{x, y}\). Let \(u\) be the left vertex in \(G\) for which the edge from \(u\) to \(v\) is in \(M\). Starting with \(M\), remove the edges from \(x\) to \(y\) and from \(u\) to \(v\), add in edges from \(x\) to \(v\) and from \(u\) to \(y\), and call the result \(M'\). Then \(M'\) is in \(\mathfrak{M}_{x, v}\). We thusly associate each element of \(\mathfrak{M}_{x, y}\) with an element of \(\mathfrak{M}_{x, v}\). Note that in fact we have associated each element of \(\mathfrak{M}_{x, y}\) with a distinct element of \(\mathfrak{M}_{x, v}\). So, \(m_{x, y} \leq m_{x, v}\), as wanted. \(\square\)
Lemma 6. Let \(G\) be a bipartite graph with \(n\) left vertices and \(n\) right vertices. Let \(x\) be a left vertex and \(y\) a right vertex such that \(x\) and \(y\) are adjacent. Let \(b\) be the number of vertices of \(G\) that are adjacent to neither \(x\) nor \(y\). Let \(m\) be the number of perfect matchings in \(G\). Let \(m_{x, y}\) be the number of perfect matchings in \(G\) that include the edge from \(x\) to \(y\). Then, \[ (n - b) m_{x, y} \leq m. \]
Note that Lemma 5 is actually a special case of Lemma 6, but we proved Lemma 5 first because we use Lemma 5 in the proof of Lemma 6. The proof uses the concept of a (partial) matching. A (partial) matching in a bipartite graph \(G\) is a subset of the edges of \(G\) such that every vertex of \(G\) is in at most one edge in the subset. One matching extends another if the latter is a subset of the former.
Proof of Lemma 6. Let \(B\) be the set of all vertices that are adjacent to neither \(x\) nor \(y\). Let \(\mathfrak{P}\) be the set of all (partial) matchings \(M\) such that every element of \(B\) is in some edge in \(M\), and every edge in \(M\) includes at least one element of \(B\).
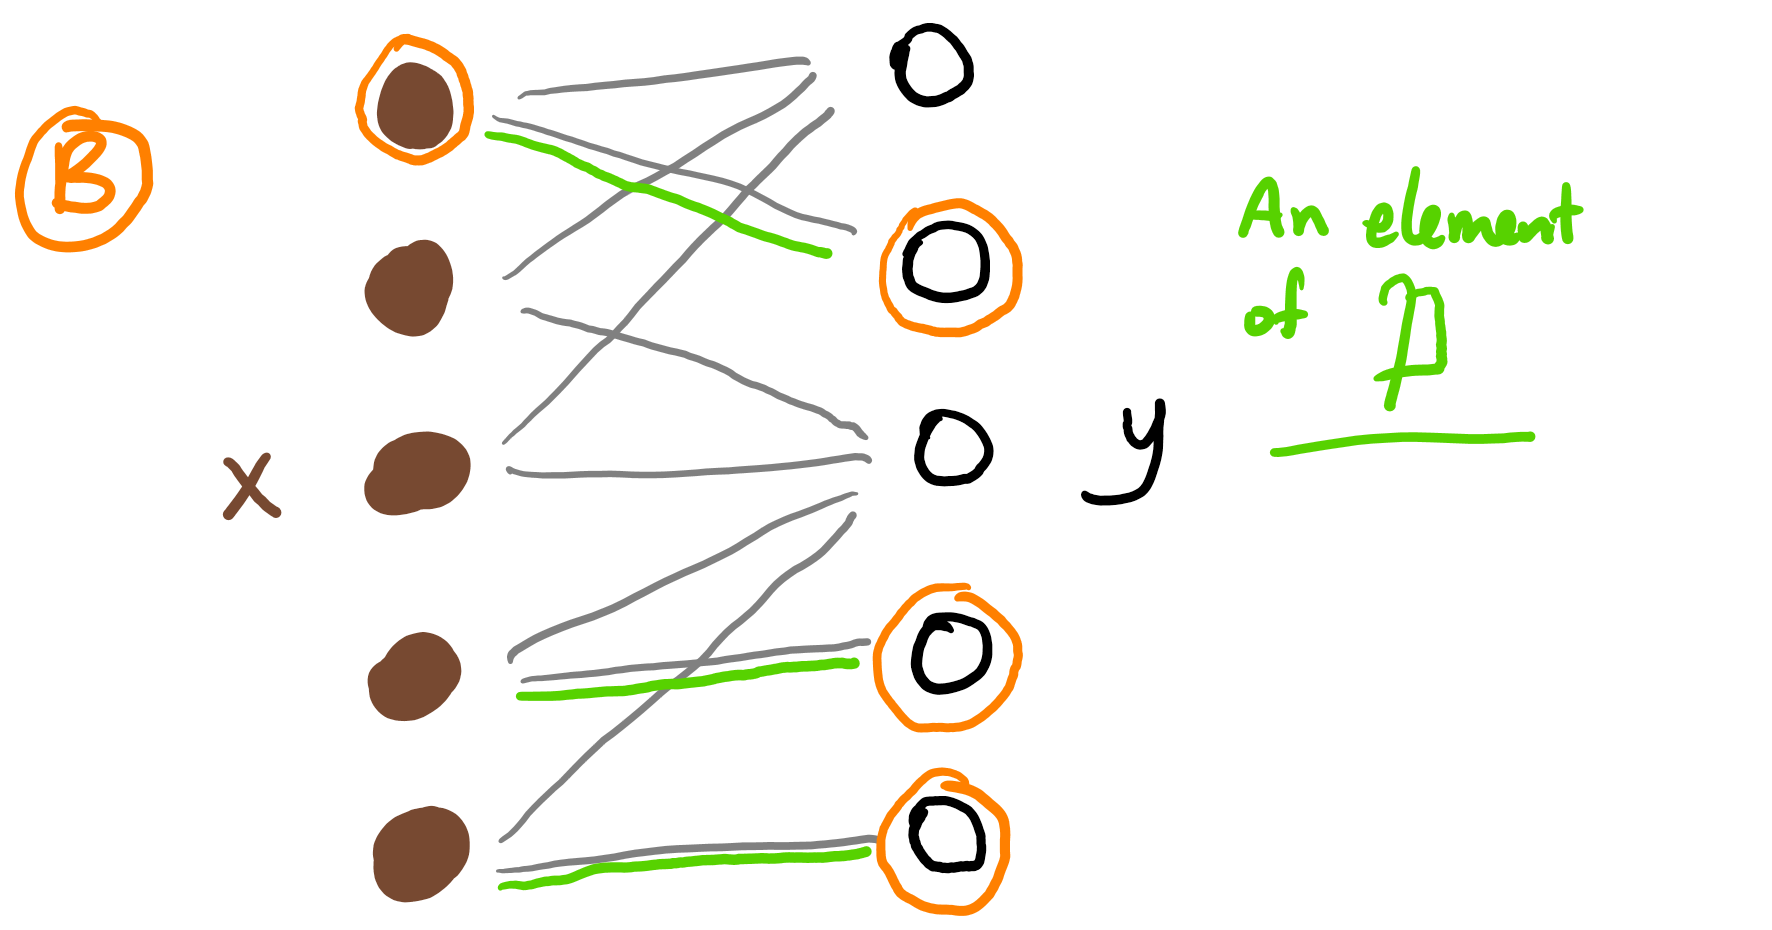
For any matching \(P\) in \(\mathfrak{P}\), let \(m^P\) be the number of perfect matchings in \(G\) that extend \(P\), and let \(m_{x, y}^P\) be the number of perfect matchings in \(G\) that include the edge from \(x\) to \(y\) and extend \(P\). We'll prove this inequality separately for each element of \(\mathfrak{P}\); that is, we'll prove \((n - b) m_{x, y}^P \leq m^P\). Our conclusion will then follow by summing these inequalities over all \(P\).
Consider any (partial) matching \(P\) in \(\mathfrak{P}\). Let \(W\) be the set of vertices that are involved in some edge of \(P\). Let \(H\) be the induced subgraph created from \(G\) by removing all the vertices in \(W\), and also removing any edges that involve these vertices.
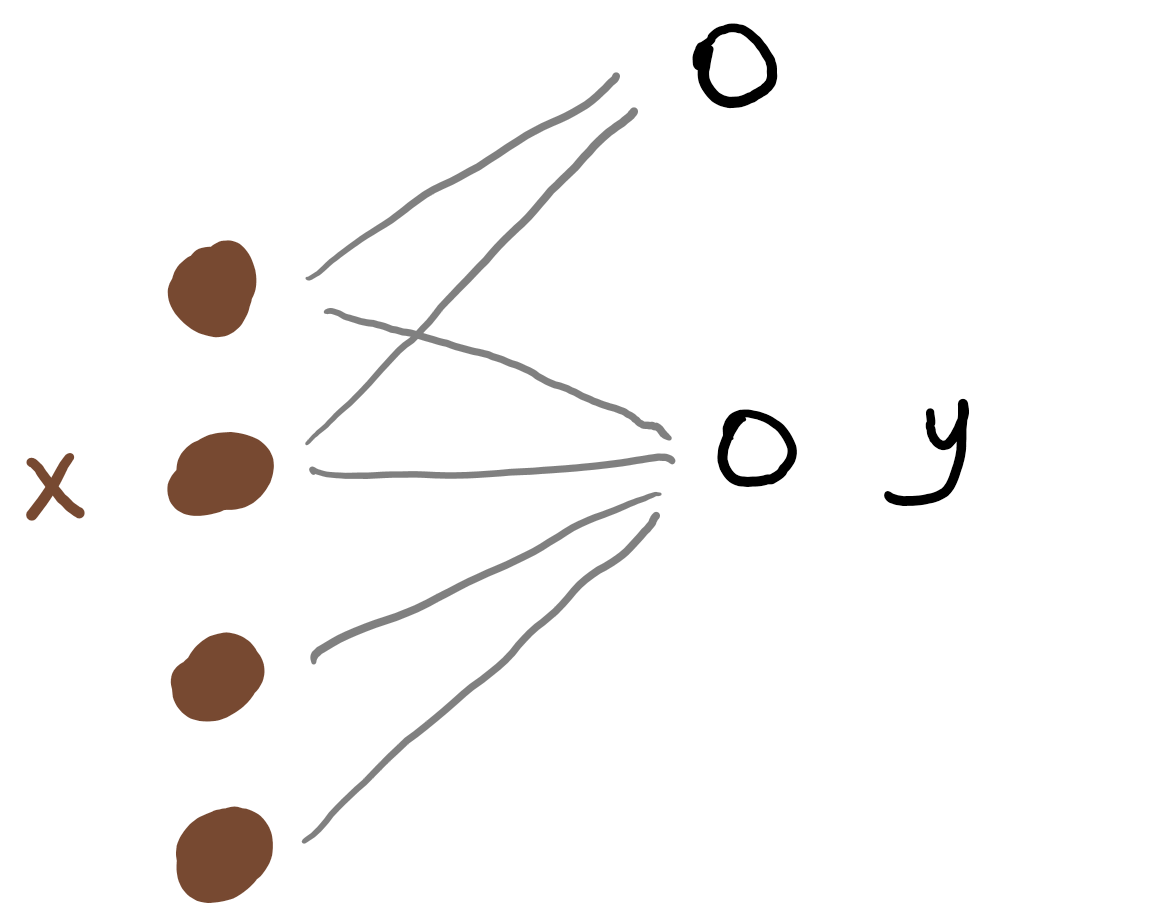
The number of perfect matchings in \(H\) is \(m^P\), and the number of perfect matchings in \(H\) that include the edge from \(x\) to \(y\) is \(m_{x, y}^P\). Since \(B\) consists of \(b\) vertices, the matching \(P\) consists of at most \(b\) edges, and so the bipartite graph \(H\) has at least \(n - b\) left vertices and \(n - b\) right vertices. The graph \(H\) satisifies the conditions of Lemma 5, so \((n - b) m_{x, y}^P \leq m^P\).
Summing over all \(P\) in \(\mathfrak{P}\), \[ (n - b) m_{x, y} = \sum_{P} (n - b) m_{x, y}^P \leq \sum_{P} m^P = m. \] This completes the proof. \(\square\)
We're now ready to prove Lemma 4, which says that Santa gains an expected value of at most one dollar with each attempted harnessing. The proof is an application of Lemma 6.
Proof of Lemma 4. Consider a situation where Santa is somewhere along in the process (it could be the beginning or somewhere in the middle). Suppose there are \(k\) reindeer left to be harnessed, and \(k\) positions left to harness them in. We'll ignore the reindeer and positions that have already been matched up. So, we can model the situation as a bipartite graph with \(k\) left vertices and \(k\) right vertices.
Let's look at when happens when Santa goes to try to harness reindeer \(x\) into position \(y\), and analyze Santa's expected earnings. Using the notation of Lemmas 4 and 5, the probability that reindeer \(x\) belongs in position \(y\) (and so the harnessing is successful) is \(\frac{m_{x, y}}{m}\). In this case, Santa earns a gold coin worth \(\frac{k + 1}{2}\) dollars. He may also need to give back some silver coins, each worth a half dollar, which he gained in unsuccessful attempts to use reindeer \(x\) or position \(y\). The number of silver coins he gives back is equal to the number of positions in the graph not adjacent to reindeer \(x\) plus the number of reindeer in the graph not adjacent to position \(y\). This is the number we called \(b\) in Lemma 6. If reindeer \(x\) does not belong in position \(y\), which happens with probability \(1 - \frac{m_{x, y}}{m}\), then Santa gains a new silver coin, worth half a dollar.
So, Santa gains treasure worth an expected value of \[ \frac{m_{x, y}}{m} \left(\frac{k + 1}{2} - b \cdot \frac{1}{2}\right) + \left(1 - \frac{m_{x, y}}{m}\right) \frac{1}{2}. \] Rearranging, this is equal to \[ \frac{(k - b) m_{x, y}}{2 m} + \frac{1}{2}. \] By Lemma 6, this is at most \[ \frac{m}{2 m} + \frac{1}{2} \leq 1, \] as wanted. \(\square\)
We've now seen all the elements of the proof. Let's finish up writing it down (somewhat) formally.
Proof of Theorem 2. By Lemma 4, every time Santa attempts to harness a reindeer (that is, every minute), he gains at most 1 dollar of treasure in expected value. Adding up all his attempts, \[ \mathbb{E}[\text{number of minutes to harness all reindeer}] \geq \mathbb{E}[\text{dollars of treasure earned}]. \] This step used my favorite mathematical fact, that expected value is linear, even for dependent random variables. (This works here because the total number of minutes is bounded; if we were trying to add infinitely many random variables, we would have to be more careful.) By Lemma 3, the number of dollars of treasure earned is always exactly \(\frac{n (n + 3)}{2}\). So, the expected number of dollars of treasure earned is also \(\frac{n (n + 3)}{2}\). We conclude, \[ \mathbb{E}[\text{number of minutes to harness all reindeer}] \geq \mathbb{E}[\text{dollars of treasure earned}] \geq \frac{n (n + 3)}{2}. \] This calculation was independent of the strategy that Santa used, so we are done! \(\square\)